
No products in the cart.

Quick Summary: Learning how to choose a paper shredder for a Saudi office depends on four measurable specifications: DIN 66399 security level, sheet pass capacity, motor duty cycle,


Executive Summary:
Tracking too many procurement metrics dilutes operational focus. This practical guide breaks down the four core operational procurement KPIs OTIF, PO cycle time, invoice match rate, and realized savings complete with mathematical formulas, worked numerical examples, a cross departmental RACI data governance matrix, and a ready to implement 100-point supplier scorecard.
Most procurement dashboards look impressive on paper until a critical shipment goes missing or an invoice dispute stalls payment. Traditional metrics often track raw purchasing activity such as total purchase orders cut or catalog quotes requested rather than operational reliability. When procurement measurements operate in isolation from warehouse receipts and accounts payable reconciliations, reported cost savings rarely reach the audited balance sheet.
To build an efficient supply chain that leadership respects, you need a disciplined framework. This guide details how to calculate the four essential operational KPIs, assign data ownership to eliminate internal blame, and build an objective supplier scorecard that holds vendors accountable.
Most procurement metric programs fail not because teams measure too little, but because they measure the wrong things in departmental silos. Procurement negotiates a 12% contractual discount, marks the deal as a victory, and logs theoretical savings. Meanwhile, warehouse staff spend hours tracking delayed freight, and accounts payable wrestles with mismatched line items.

This disconnect creates the classic “Metrics Cemetery”: dashboards crowded with 25 passive indicators that no one acts upon.
A second major point of failure is fragmented data ownership. When a delivery is logged as late, procurement blames the vendor, the vendor blames the courier, and the receiving team reveals the shipment actually sat at the receiving dock for two days before being scanned.
In regional hubs like Riyadh, Jeddah, and Dammam, this operational friction is amplified by regulatory requirements. Under Saudi Arabia’s ZATCA Phase 2 e-invoicing mandate, an unverified unit price or an inaccurate purchase order reference does not just cause a delay it halts automated tax clearance, blocks invoice matching, and strains key supplier relationships.
Teams should transition from basic activity tracking to operational impact metrics the moment procurement moves from occasional purchasing to ongoing supply chain management.
If your organization processes more than 50 purchase orders a month or manages multi-site facilities across different cities, measuring simple activity (such as counting purchase requests or tracking total spend) becomes a liability.
| Operational Indicator | Early Stage Activity Metric (Vanity) | Mature Operational Impact Metric (Value) |
| Delivery Tracking | Supplier Delivery Promise Date | Compound On-Time In-Full (OTIF) % |
| Purchasing Speed | Number of POs generated per buyer | Internal PR to PO Cycle Time (in hours) |
| Billing & Accounts Payable | Total volume of invoices processed | First Time 3-Way Invoice Match Rate % |
| Cost Management | Negotiated discount percentage | Actual Realized Savings vs. Spend Leakage |
The trigger point for this shift is visible in daily operations: when departmental heads resort to “maverick buying” on company credit cards because formal purchase approvals take weeks, or when finance flags quarterly budget variances on contracted items. At that stage, you need operational metrics that diagnose friction across the procure to pay (P2P) cycle.
Operational excellence rests on four fundamental procurement KPIs. Below are the precise mathematical formulas, operational definitions, and worked real world scenarios for each.

Definition: On-Time In-Full (OTIF) measures the percentage of orders delivered strictly within the agreed contractual delivery window, containing the exact quantities ordered, with zero defects or damaged goods.
Important: OTIF is a strict, compound metric. If an order arrives on schedule but is missing 5% of its line items, it is scored as a 0. If an order is 100% complete but arrives one day late, it is also scored as a 0. Combining on-time rates with fulfillment rates using a simple mathematical average hides chronic operational delays.

Worked Numerical Example:
A corporate facility orders quarterly workplace and operational consumables through a local distributor, logging 250 total deliveries across the quarter:
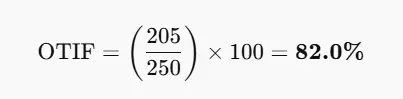
The Operational Insight: A supplier reporting an “On-Time Rate” of 90% and a “Fill Rate” of 89% might look acceptable. However, true OTIF reveals that 18% of all shipments caused administrative or operational delays for on-site facility teams.
Definition: PO Cycle Time quantifies the total business hours or days required to turn an employee purchase requisition (PR) into an approved, dispatched Purchase Order sent to the supplier.

To measure end to end procurement lead time, calculate the duration from initial PR submission through final Goods Receipt Note (GRN) entry:

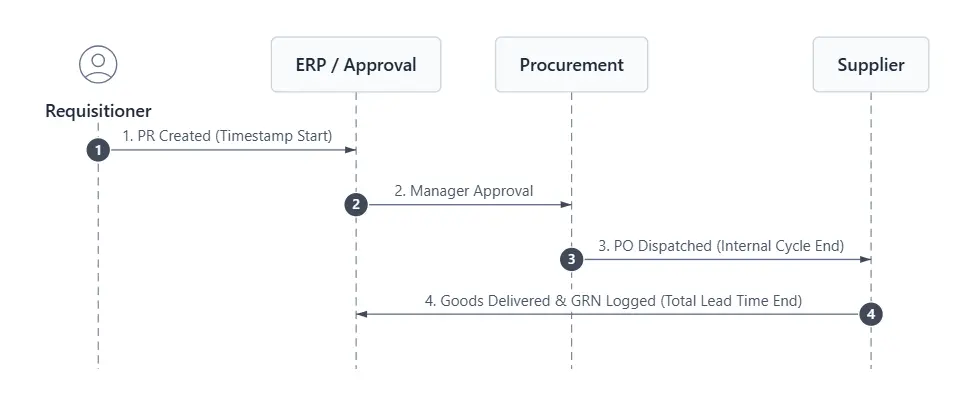
An operations team audits 80 purchase orders for routine IT peripherals and breakroom consumables over a month:


The Operational Insight: Standardizing repeat office and operational categories through contracted digital catalogs slashes internal cycle times by 90%, liberating procurement teams from routine operational paperwork.
Definition: The First Time Invoice Match Rate tracks the percentage of supplier invoices that reconcile cleanly against the Purchase Order (PO) and Goods Receipt Note (GRN) on the first pass without human intervention or billing disputes.
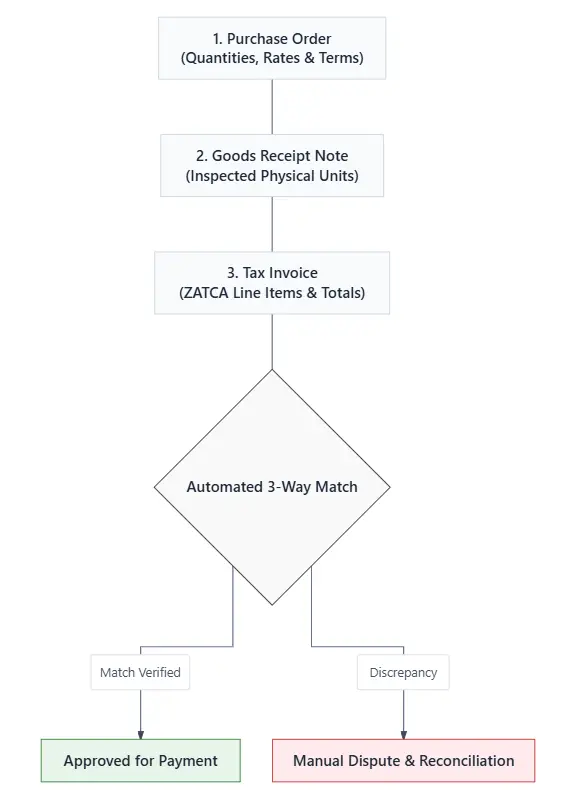

Worked Numerical Example:
An enterprise processes 600 vendor invoices in a fiscal month:

The Operational Insight: The remaining 108 non matching invoices require manual intervention. At an industry standard average of 45 minutes per dispute investigation, this non compliance consumes 81 hours of accounting overhead per month, delaying payment cycles and incurring supplier friction.
Definition: Negotiated Savings represents theoretical cost reductions calculated at the time of contract execution. Realized Savings measures the actual, audited funds saved across the contract lifespan based on verified purchases.

The delta between these two values is your Savings Leakage:

A company renegotiates its annual workspace and operational supply contract across regional branches:
At year end audit, the actual financial books show:
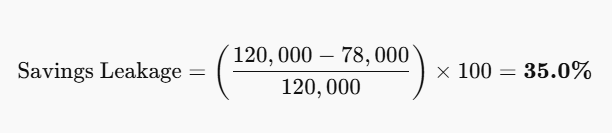
The Operational Insight: More than one-third of the negotiated financial savings vanished due to poor contract enforcement and unmonitored rogue purchasing.
Without clear data ownership, procurement metrics lead to interdepartmental finger pointing. Assigning responsibility across the procurement life cycle ensures that every timestamp, receipt, and invoice remains untampered and verified.
| Lifecycle Stage & Metric | Key Trigger Event | Responsible (R) | Accountable (A) | Consulted (C) | Informed (I) |
| PO Cycle Time (PR to PO) | Requisition submission →\rightarrow→ Dispatch to vendor | Purchasing Specialist | Head of Procurement | Department Requester | Finance Controller |
| On-Time Delivery Timestamp | Physical arrival at facility loading bay | Receiving Clerk / Admin | Logistics Manager | Delivery Carrier | Purchasing Team |
| In-Full & Quality Verification | GRN entry →\rightarrow→ Physical unit damage inspection | Warehouse Supervisor | Facility Operations Lead | Purchasing Specialist | Accounts Payable |
| 3-Way Match Reconciliation | Matching PO, GRN, and ZATCA tax invoice | Accounts Payable Clerk | Finance Manager | Procurement Buyer | Vendor Account Manager |
| Realized Savings Verification | Monthly spend audit against contract baselines | Category Manager | Chief Financial Officer (CFO) | Internal Audit | Executive Leadership |
“When a delivery date is missed, operations usually blames the supplier. But when you examine the RACI trail, you often discover the purchase order sat in an internal approval queue for five days. Reliable metrics demand process discipline before vendor critique.”— Dr. Tariq Al-Hussaini, Enterprise Supply Chain Advisor
A supplier scorecard should be balanced, objective, and shared openly with vendors before contract execution. Avoid subjective assessments like “supplier attitude”; evaluate partners using a 100-Point Weighted Scoring Model built on verifiable operational data.

| Evaluation Pillar | Weight | Target Metric | Minimum SLA Benchmark | Scoring Mechanism (0–100 Scale) |
| 1. Delivery Reliability | 30% | On-Time In-Full (OTIF) | ≥ 95% across quarterly orders | ≥ 95% = 100 pts |
| 2. Commercial & Quality Accuracy | 25% | First-Time Invoice Match Rate & Zero Return Rate | ≥ 92% Invoice Match;< 1% Defective / Rejected Units | Deduct 5 points per invoice billing dispute or returned batch |
| 3. Cost & Contract Adherence | 25% | Price Catalog Stability & Accurate Quoting | 100% compliance with negotiated catalog terms | 100 pts for full pricing adherence; Any unapproved price variation = 0 points |
| 4. Service & Regulatory Compliance | 20% | Issue resolution speed & ZATCA Phase 2 compliance | Issue resolution <4 hours;100% valid electronic tax invoices | Audit based on documented support tickets and tax invoice validation |
Evaluate your scorecard data during structured Quarterly Business Reviews (QBRs) to place suppliers into actionable performance tiers:
Managing dozens of unvetted vendors across multiple corporate locations fundamentally weakens your procurement KPIs. When an organization uses 30 different suppliers for stationery, breakroom products, IT peripherals, and managed print and copier rentals, operational inefficiencies multiply:
By transitioning to an integrated workplace supplier like Supplies Hub, companies consolidate fragmented tail spend under a single master service agreement.
Enterprise clients operating across Riyadh, Jeddah, and the Eastern Province gain scheduled, unified delivery runs, guaranteed catalog pricing, and clean, consolidated electronic invoicing. Consolidating vendors immediately shortens internal cycle times, drives invoice match rates above 95%, and eliminates the maverick buying that erodes savings.
To upgrade your procurement metrics from passive reporting to active performance drivers:

Quick Summary: Learning how to choose a paper shredder for a Saudi office depends on four measurable specifications: DIN 66399 security level, sheet pass capacity, motor duty cycle,
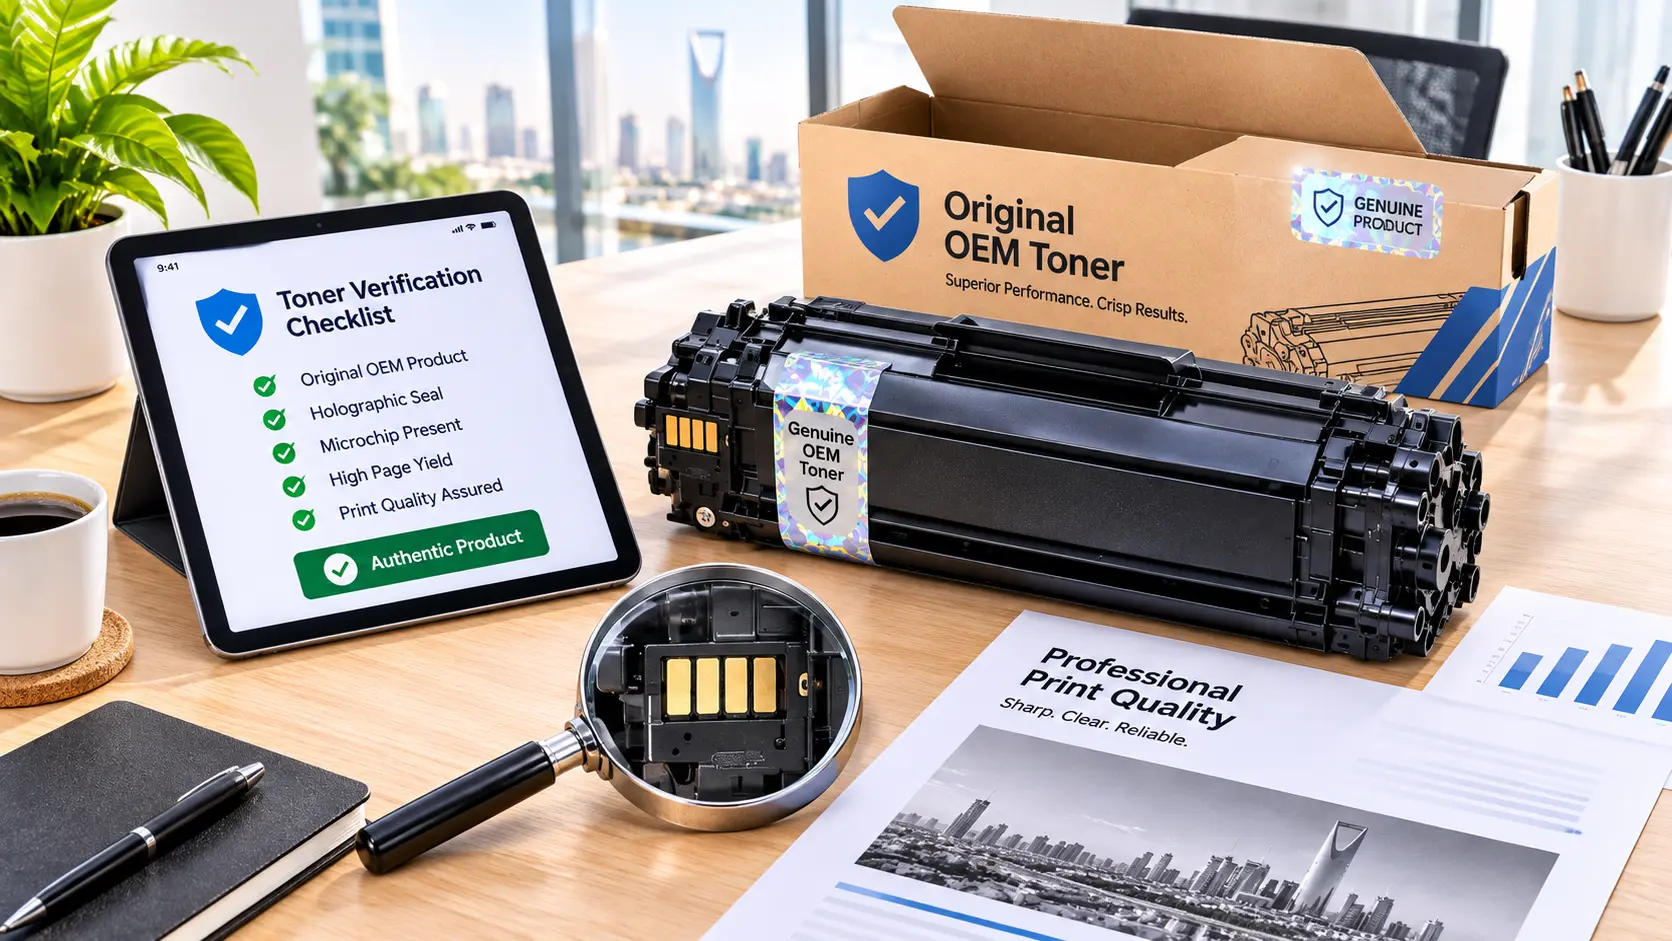
Quick Summary: Comparing original vs compatible toner comes down to four measurable factors: verifiable supply origin, serialized batch traceability, standardized ISO/IEC page yield, and clear hardware support terms.

Quick Summary: Choosing between 70 vs 80 gsm paper depends on document readability, printer feed limits, and double sided ink coverage rather than assuming heavier paper solves every