
No products in the cart.
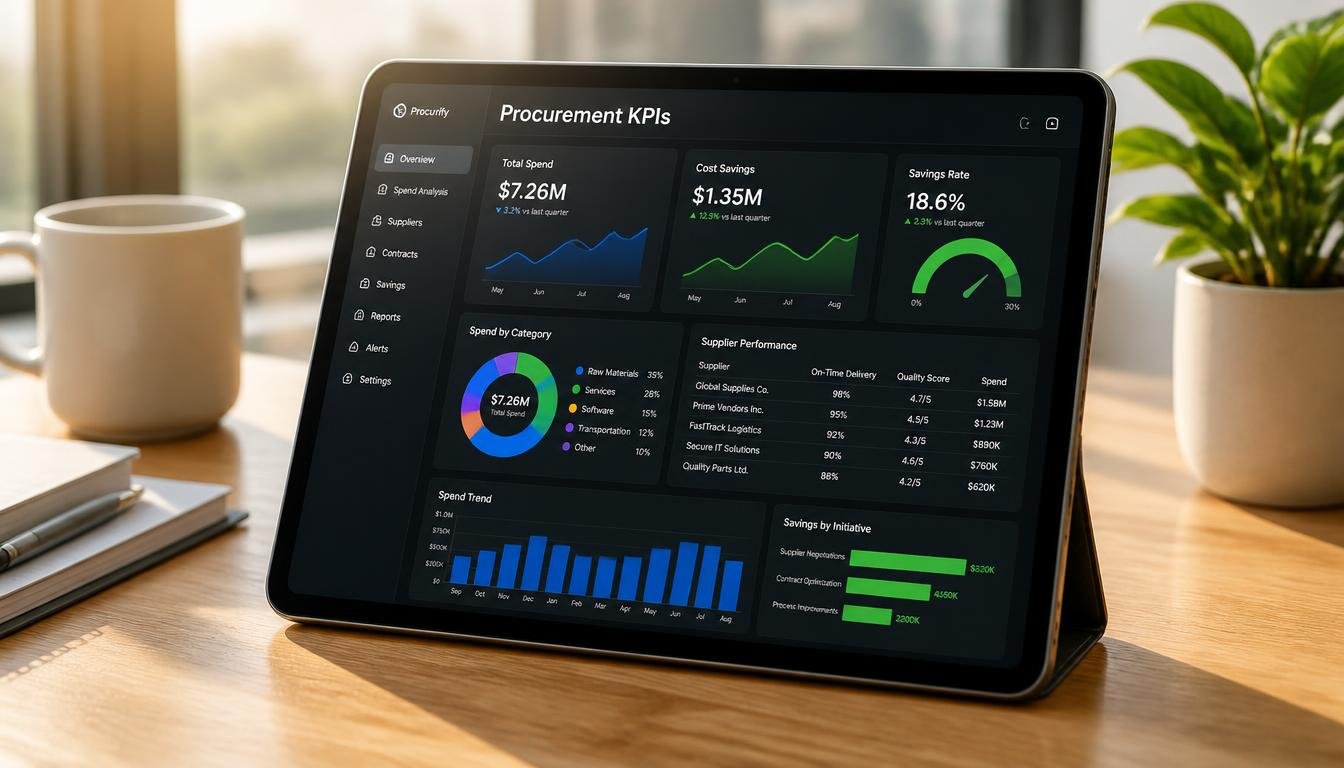
Summary: Looking to measure the true impact of your procurement department? This complete 2026 guide covers the exact Cost, Operational, Supplier, and Strategic KPIs that Finance and Operations

Summary:
Looking to measure the true impact of your procurement department? This complete 2026 guide covers the exact Cost, Operational, Supplier, and Strategic KPIs that Finance and Operations leaders need to track, complete with formulas and industry benchmarks.
Procurement has shifted from a simple back-office purchasing function to a strategic powerhouse that drives enterprise value. If you want to protect margins, mitigate supply chain risks, and impress your CFO, tracking the right procurement KPIs (Key Performance Indicators) is no longer optional it is essential. However, many organizations still struggle to measure what actually matters, often getting bogged down in vanity metrics instead of focusing on bottom-line financial impact. In this guide, we will break down why measuring procurement performance is critical, exactly which metrics you need to track, how to calculate them, and when to review your data to stay ahead in 2026.
For modern Finance and Operations directors, procurement is the frontline defense against inflation and margin erosion. When you measure procurement performance effectively, you move beyond simply “buying things cheaper.” Instead, you align your procurement strategy with broader enterprise objectives, ensuring every Riyal spent delivers maximum value.
Tracking the right purchasing KPIs helps you identify and eliminate rogue spending (maverick spend), streamline operational bottlenecks in your Procure-to-Pay (P2P) cycle, and proactively manage supplier risks. For businesses operating in Saudi Arabia, aligning these metrics with the goals of Saudi Vision 2030 such as digital transformation, local content development, and operational efficiency provides a massive competitive edge.
By utilizing a data-driven procurement dashboard, operations teams can anticipate supply chain disruptions before they happen, while finance teams gain the visibility required to accurately forecast cash flow.
“Procurement KPIs are no longer just about tracking pennies; they are the early warning system for enterprise risk and margin erosion. If you aren’t measuring supplier performance and cost avoidance in real-time, you are flying blind.” — Supply Chain & Finance Expert
Whether you are deciding between strategic procurement vs tactical procurement or mapping out your procurement process steps, your KPIs dictate your success.
To build a well-rounded procurement dashboard, you must categorize your metrics so that different stakeholders (Finance, Operations, ESG) get the insights they need. Below are the top KPIs categorized by Cost, Operational Efficiency, Supplier Performance, and Strategic impact, complete with calculation formulas and 2026 industry benchmarks.
| KPI Category | Key Metric | What it Measures | 2026 Benchmark |
| Financial | Spend Under Management (SUM) | % of total spend managed by procurement | > 85% |
| Financial | Maverick Spend Rate | % of spend outside negotiated contracts | < 5% |
| Operational | PO Cycle Time | Time from requisition to PO generation | < 24 Hours |
| Operational | Procurement ROI | Savings generated vs. operational cost | 5x – 8x ROI |
| Supplier | Supplier Defect Rate | % of defective items received | < 1% |
| Strategic | Sustainable/Local Spend (ICV) | % of spend directed to local/ESG vendors | > 30% |
Finance leaders care about cash flow, cost reductions, and budget adherence. These metrics prove your procurement department’s direct financial ROI.
1. Cost Savings vs. Cost Avoidance
2. Spend Under Management (SUM)
3. Maverick Spend Rate
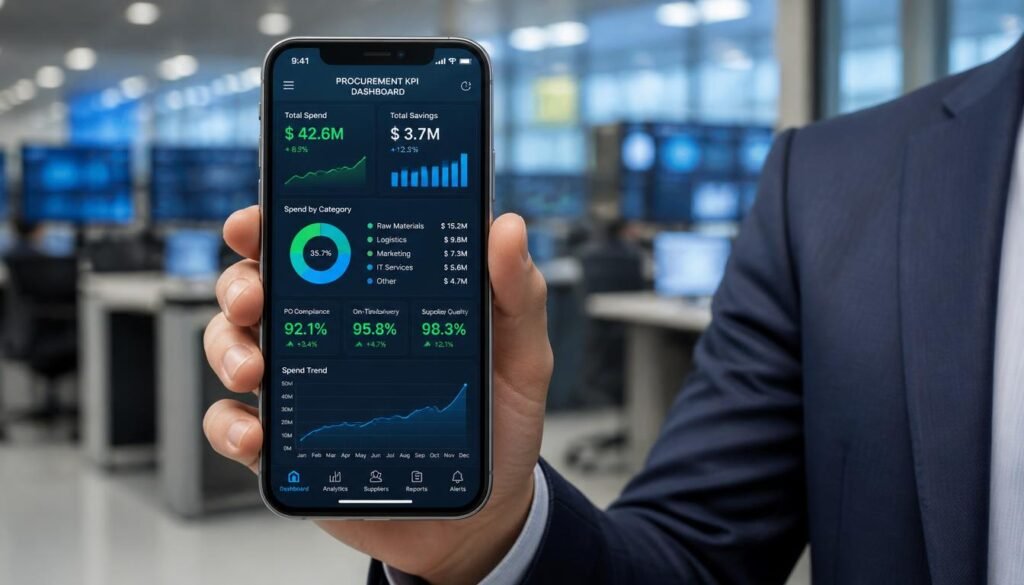
Operational KPIs measure the friction in your purchasing processes. Smooth operations mean faster turnaround times and lower administrative costs.
4. Purchase Order (PO) Cycle Time
5. Invoice Exception Rate
6. Procurement ROI (Return on Investment)
Your supply chain is only as strong as your weakest vendor. Monitoring supplier performance helps you mitigate risk and ensure operational continuity.
7. Supplier Defect Rate (Quality metric)
8. On-Time Delivery Rate
9. Supplier Lead Time
Modern procurement is increasingly judged on its contribution to corporate social responsibility, diversity, and local economic growth.
10. Sustainable and Local Spend (ICV)
Tracking these KPIs manually on static Excel spreadsheets is a recipe for disaster. The data will be outdated by the time you present it to the board, and the margin for human error is exceptionally high.
To properly measure procurement performance in 2026, organizations must implement dynamic, automated P2P dashboards integrated directly with their ERP systems. A data-driven dashboard does the heavy lifting for you by automatically calculating formulas in real-time.
Recent industry data from leading analyst firms highlights that top-performing procurement teams are heavily investing in AI and automation. According to Deloitte’s recent Global Chief Procurement Officer Survey, high-performing procurement teams allocate up to 24% of their budgets to digital technology and realize a 3.2x ROI on those investments.
“Data visibility separates top-quartile procurement teams from the rest. When you automate KPI tracking through AI and dynamic dashboards, your procurement team stops acting as data-entry clerks and starts acting as strategic analysts.” — Industry Benchmarking Report
AI-driven anomaly detection can now flag maverick spend or sudden drops in supplier on-time delivery rates before they severely impact operations. Understanding the differences between procurement vs purchasing is key here: purchasing is the transactional act of buying, but procurement is the strategic methodology of sourcing, analyzing data, and managing supplier relationships through advanced dashboards.
When Should You Review and Adjust Your Procurement KPIs?
Collecting data is only half the battle; knowing when to review and act upon it is what separates average teams from industry leaders.
A carefully curated list of procurement KPIs turns your department from a traditional cost center into a strategic value creator. By accurately tracking cost savings, measuring supplier reliability, and monitoring operational efficiency, you provide the C-suite with the actionable intelligence they need to make highly profitable decisions.
To achieve this, you need the right tools, the right vendor relationships, and a commitment to continuous improvement. If you are looking to streamline your procurement processes, access top-tier corporate office equipment, and gain better visibility into your supply chain in the KSA region, explore the solutions offered by Supplies Hub. A smarter, data-driven procurement strategy starts today.

Summary: Looking to measure the true impact of your procurement department? This complete 2026 guide covers the exact Cost, Operational, Supplier, and Strategic KPIs that Finance and Operations

The business landscape in Saudi Arabia is evolving at an unprecedented pace, largely fueled by the ambitious goals of Vision 2030. As companies scale rapidly across Riyadh, Jeddah,

Summary: “While tactical purchasing focuses on day-to-day transactions and immediate cost savings, strategic procurement builds long-term partnerships that drive overall business growth. In this guide, KSA business leaders